ConversionGraph
can be customized by the user.
API Reference:
qbraid.transpiler
Conversion Graph
To view what conversions are available, you can plot theConversionGraph:
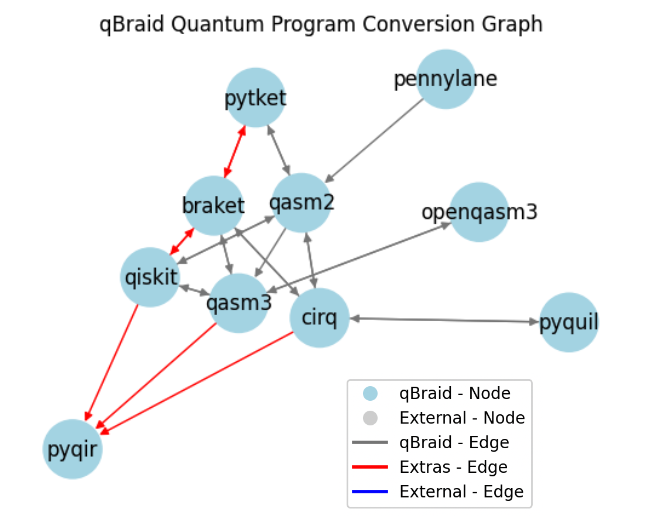 Gray arrows denote conversions implemented and managed by qBraid. Red arrows represent conversions implemented
by external packages or extensions. These are automatically incorporated into the conversion graph upon
installing the specified ‘extra’.
You can use the native conversions supported by qBraid, or define your own custom nodes and/or edges. For example:
Gray arrows denote conversions implemented and managed by qBraid. Red arrows represent conversions implemented
by external packages or extensions. These are automatically incorporated into the conversion graph upon
installing the specified ‘extra’.
You can use the native conversions supported by qBraid, or define your own custom nodes and/or edges. For example:
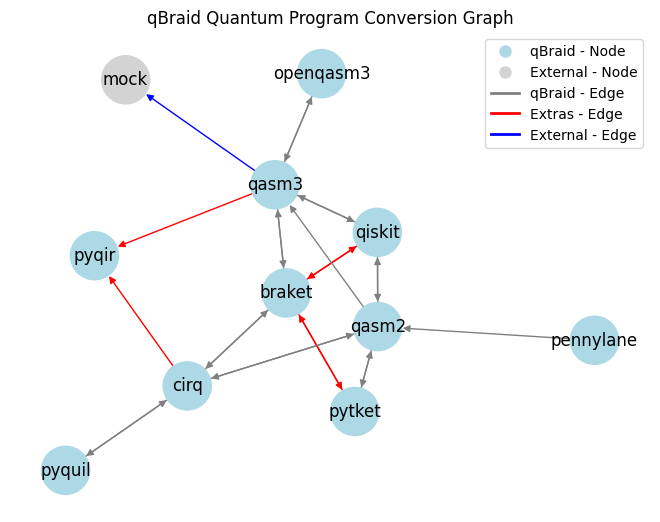 Blue arrows indicate conversions added by the user during their current session.
Check if a conversion is supported between two given program types, and if so, what “conversion path(s)” would be used:
Blue arrows indicate conversions added by the user during their current session.
Check if a conversion is supported between two given program types, and if so, what “conversion path(s)” would be used:
conversions list:
Conversion Scheme
TheConversionScheme data class details information about conversion configurations, such as numbers of nodes and edges, as well as max depth.
Transpile
Using theqbraid.transpile function, simply pass in the name of the target package from one of qbraid.QPROGRAM_ALIASES. For example, use input "cirq" to return a cirq.Circuit:
"pyquil" to return a pyquil.quil.Program:
See also:
- Transpiler Demo Notebook: General Usage